ABA Data Collection Methods: Frequency, Duration, Interval and Latency Compared
Which measurement system fits the behavior you are tracking. Frequency, duration, latency, interval, and the rest, with the question each one answers and a free printable sheet for every method.
Key Takeaways
- Pick the method from the question, not from habit. How often uses frequency, how long uses duration, how soon after the instruction uses latency, and whether it happened at all in a window uses interval recording.
- Frequency only means something when the observation window is fixed. Eleven instances is not comparable to nine unless both were counted over the same length of time, which is why rate, meaning count divided by time, is safer whenever session length moves.
- Interval recording is an estimate and should be labeled as one. Partial interval overestimates how much a behavior occurs and whole interval underestimates it, and that bias is a feature you choose deliberately, not an error to apologize for.
- If you cannot tell where one instance stops and the next starts, do not count it. Behaviors without a clean beginning and end, like rocking or humming, belong in interval recording or a momentary time sample rather than a frequency tally.
- The best method is the one the person in the room can actually run. A perfect measurement system nobody completes during a real session produces less usable data than a rougher one that gets filled in every day.
Most data collection problems in ABA are not effort problems. Somebody is recording faithfully, every session, on a sheet that cannot answer the question the goal is actually asking.
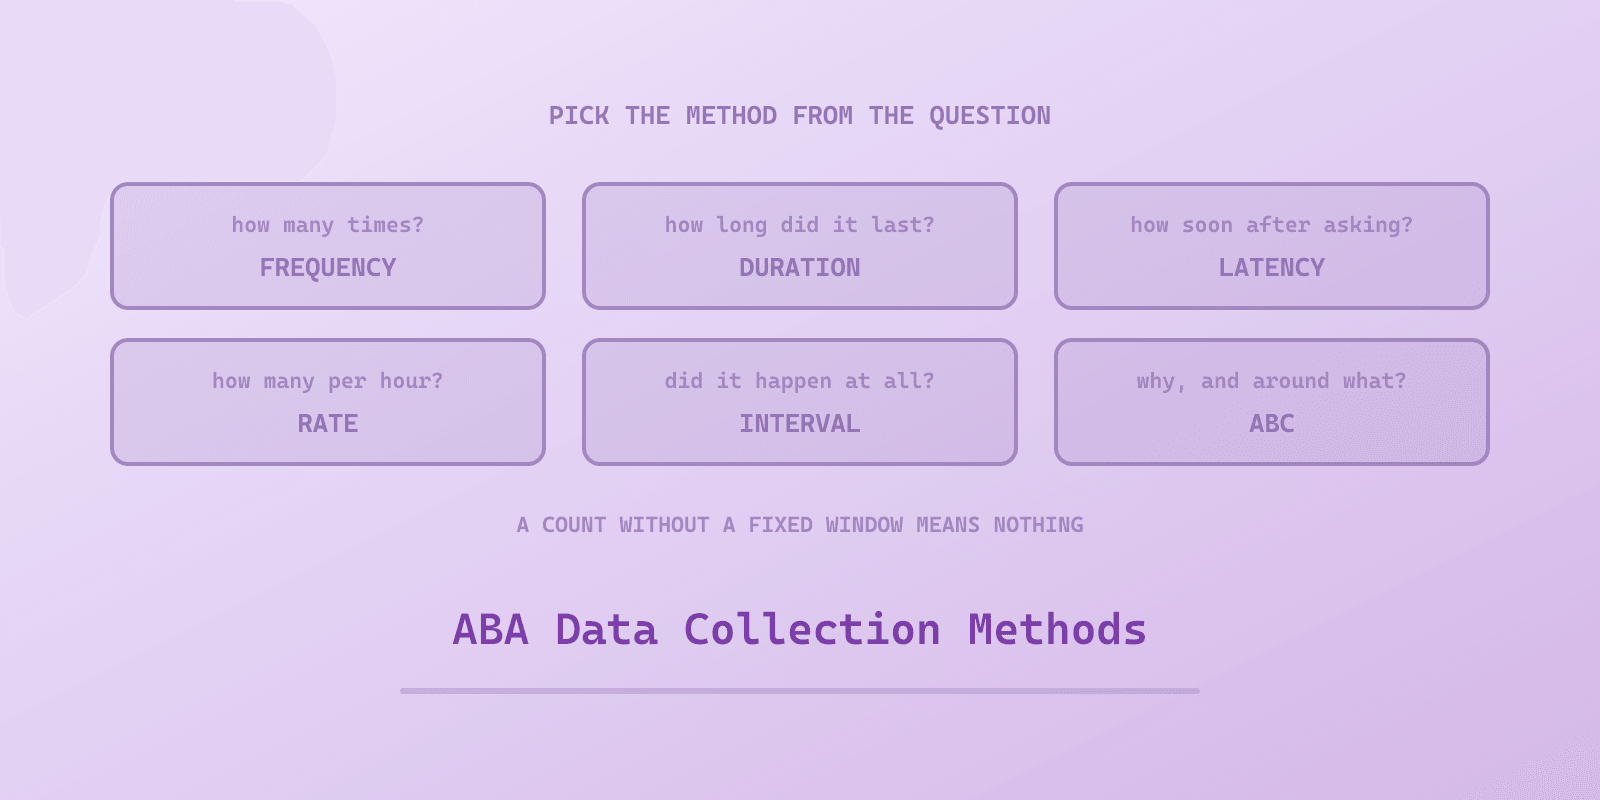
The fix is boring: choose the method from the question. Six questions cover almost everything a program measures.
- How many times did it happen? Frequency count
- How many times per hour, when sessions vary in length? Rate
- How long did it last? Duration
- How long before they started, after being asked? Latency
- Did it happen at all during this window? Interval recording
- Why is it happening, and around what? ABC recording or a scatterplot
Every one of those has a free printable sheet on the ABA therapy resources hub, and each opens in a maker so the learner, the targets, and the session times are on the page before it prints.
The methods, and what each one is actually for
| Method | The question it answers | Fits behaviors that are | Sheet |
|---|---|---|---|
| Frequency | How many times | Countable, discrete, similar in length | Frequency Data Sheet |
| Rate | How many per unit of time | Countable, but sessions vary in length | Rate Data Sheet |
| Duration | How long it lasted | Long or variable, where length is the problem | Duration Data Sheet |
| Latency | How long until it started | Cued, where the delay is the concern | Latency Data Sheet |
| Interval | Whether it happened in a window | Continuous or hard to count cleanly | Interval Recording Sheet |
| Scatterplot | When in the day it clusters | Suspected to follow a time or activity pattern | Scatterplot Data Sheet |
| ABC | What surrounds it | Not yet understood functionally | ABC Data Sheet |
Frequency, and the mistake that makes it meaningless
Frequency is a tally. Its weakness is that a bare count carries no time information, so eleven instances on Monday and nine on Tuesday tell you nothing unless both days were observed for the same length of time.
Two habits fix it. Fix the observation window and write it on the sheet, or switch to rate, which divides the count by the time observed and stays comparable when a session runs short. Any goal written as "fewer than five per day" quietly assumes a full day was watched, and that assumption is usually false by Thursday.
Frequency also needs the behavior to have a clean start and stop. If you cannot say where one instance ended and the next began, you are not counting, you are estimating, and interval recording is the honest version of that.
Duration, when the count hides the problem
Eight thirty-second protests and one forty-minute meltdown are the same number on a frequency sheet. Duration is what separates them.
Use it when length is the thing that matters: tantrums, time out of area, time to complete a transition, or engagement you are trying to extend. Duration also tends to move before frequency does when an intervention starts working, because episodes usually get shorter before they get rarer. A program measured only by count can look flat for weeks while it is genuinely improving.
Latency, the one most often skipped
Latency is the gap between the instruction and the start of the response. It fits compliance goals, transition goals, and task initiation, and it catches progress the other methods miss.
A learner who took four minutes to start a non-preferred task and now takes forty seconds has improved a great deal. On a frequency sheet counting tasks started, that improvement is invisible, because the count was one before and is still one.
Interval recording, and choosing your bias on purpose
Interval recording splits the observation into equal chunks and scores each chunk rather than each instance. It is the practical choice for behaviors that are continuous, high-rate, or hard to separate into countable units.
The three variants do not measure the same thing:
- Partial interval: score the interval if the behavior happened at any point. Overestimates. Best for behaviors you are trying to reduce, because it is sensitive to any occurrence.
- Whole interval: score it only if the behavior lasted the entire interval. Underestimates. Best for behaviors you are trying to increase, such as sustained on-task time, because it sets a strict standard.
- Momentary time sampling: score only what was happening at the instant the interval ended. Least intrusive, and the most realistic option for one adult supervising a group.
Interval data is an estimate, and the honest thing to do is label it as one. Reporting "on task during 70 percent of intervals" is accurate; reporting "on task 70 percent of the time" is not the same claim, and the difference matters at a meeting where placement is being discussed.
ABC and scatterplot, when you do not know yet
Both describe context rather than quantity, and both belong at the start, before a target is defined.
ABC recording captures what came before and what followed, which is how a pattern becomes a hypothesis about function. A scatterplot maps occurrences onto times of day and activities, which surfaces the pattern nobody notices in the moment, like a behavior that only appears in the twenty minutes before lunch. Spectrum Unlocked's ABC data sheet guide walks through filling one in and reading the pattern out of it.
Match the method to the goal, in that order
The sequence that prevents wasted data collection is short:
- Write the goal, naming the dimension explicitly (count, rate, duration, latency, or percent of intervals)
- Choose the method that measures that dimension
- Choose the sheet that runs that method
- Check that the person recording can complete it during a real session
Step 4 is the one that gets skipped, and it decides whether any of the first three matter. A measurement system nobody can run produces gaps, and gaps get filled in from memory at the end of the week, which is worse than a rougher method recorded honestly. The IEP Goal Builder writes goals with the dimension and criterion stated, which makes step 2 mostly automatic.
A note on comparing your data to itself
Whatever method you choose, keep it stable long enough to mean something. Switching from partial interval to whole interval mid-program will show a dramatic drop that is entirely an artifact of the method, and the same is true of moving from a full-day count to a twenty-minute sample.
If a method has to change, mark the date on the graph and treat what comes after as a new baseline. A line that looks like progress because the ruler changed is the single easiest way to mislead a team, including yourself.
Skill-acquisition programs measure differently again, by scoring each step of a chain rather than counting a behavior: task analysis in ABA covers how to build the step list and why prompt level beats a pass or fail column.
The full set of printable sheets, grouped by what they measure, sits on the ABA therapy resources hub. If you are handing any of them to a family to complete between sessions, ABA parent training handouts covers which ones caregivers can realistically run.
The data is the easy part. The write-up is what takes the evening.
Beacon remembers your caseload and your setting, so you are not re-explaining them every time.
What would Beacon say?
"Help me set up data collection for this goal"
Beacon takes the goal you are already running, suggests the measurement that actually fits it, and drafts the note that has to follow.

Spectrum Unlocked Editorial Team
Editorial Team
The Spectrum Unlocked editorial team combines lived experience as autism parents with research-backed guidance to create resources families can trust.
Frequently asked questions
- What are the main data collection methods in ABA?
- The continuous methods record every instance: frequency counts how many times a behavior happens, rate expresses that count per unit of time, duration records how long it lasts, and latency records how long it takes to begin after a cue or instruction. The discontinuous methods sample instead of counting everything: partial interval records whether the behavior happened at any point in an interval, whole interval records whether it happened throughout, and momentary time sampling records only whether it was happening at the moment the interval ended. ABC recording and scatterplot analysis sit alongside these and describe context rather than quantity.
- What is the difference between partial interval and whole interval recording?
- Partial interval scores the interval if the behavior occurred at any point during it, so it overestimates how much the behavior actually happened. Whole interval scores the interval only if the behavior lasted for the entire interval, so it underestimates. That direction of error is the reason to choose one over the other: partial interval suits behaviors you want to reduce, because it is sensitive to any occurrence, and whole interval suits behaviors you want to increase, such as on-task engagement, because it sets a demanding standard.
- When should you use frequency instead of duration?
- Use frequency when the behavior is countable and each instance is roughly similar in length, such as hand raises, requests, or hits. Use duration when the length is the problem rather than the count, such as tantrums, time out of seat, or how long a transition takes. A single tantrum lasting forty minutes and eight lasting thirty seconds each look identical on a frequency sheet, which is exactly the situation duration exists for.
- What is latency recording used for?
- Latency measures the time between a cue and the start of the behavior, so it fits goals about responding to instructions, starting tasks, or transitioning when asked. It is the right method when the concern is not whether the child does the thing but how long the gap is before they begin. It also exposes progress that frequency hides: a learner who used to take four minutes to start and now takes forty seconds has improved substantially while the count of started tasks may not have moved at all.
- How do you collect ABA data in a busy classroom?
- Reduce what is being measured until the method survives the room. Sampling a fixed twenty-minute window each day usually beats attempting all-day continuous recording and abandoning it by Wednesday. Momentary time sampling is the least intrusive option because it asks for one glance per interval rather than continuous attention. Whatever the method, the sheet should be within arm's reach of where the behavior happens, and the person recording should be able to complete an entry without stopping what they are doing.
- Which ABA data sheet should I use for a new behavior?
- If the function is still unknown, start with ABC recording or a scatterplot, because both describe context and neither assumes you already know what to count. Once the function is identified and a target is defined, move to the method that matches the dimension named in the goal: count, rate, duration, latency, or interval. Writing the goal first and choosing the sheet second is the order that prevents collecting data nobody can use.