ABC Data Sheet: How to Take ABC Data (Free Printable)
What an ABC data sheet is, how to collect antecedent-behavior-consequence data step by step, a filled-in example, and a free printable ABC sheet to download.
Key Takeaways
- An ABC data sheet records three things every time a target behavior happens: the antecedent (what came right before), the behavior (what the student did, in observable terms), and the consequence (what happened right after).
- The point of ABC data is not to count the behavior. It is to spot the pattern that reveals the behavior's function: escape, attention, access to something, or sensory input.
- Reliable ABC data starts with an operational definition anyone can score the same way, and short, consistent observation windows beat an all-day log you abandon by Wednesday.
- Collect ABC data over two to four weeks, then look for the antecedent and consequence that repeat. That pattern is what turns an FBA and behavior plan from a guess into a measurable intervention.
If a student keeps hitting, eloping, or shutting down and no one can say why, an ABC data sheet is how you find out. It is the single most useful form in a special education classroom, because it turns "he just does it out of nowhere" into a pattern you can actually see and act on. Setting up that classroom from scratch? The self-contained classroom setup guide covers where the data corner goes.
What an ABC data sheet is
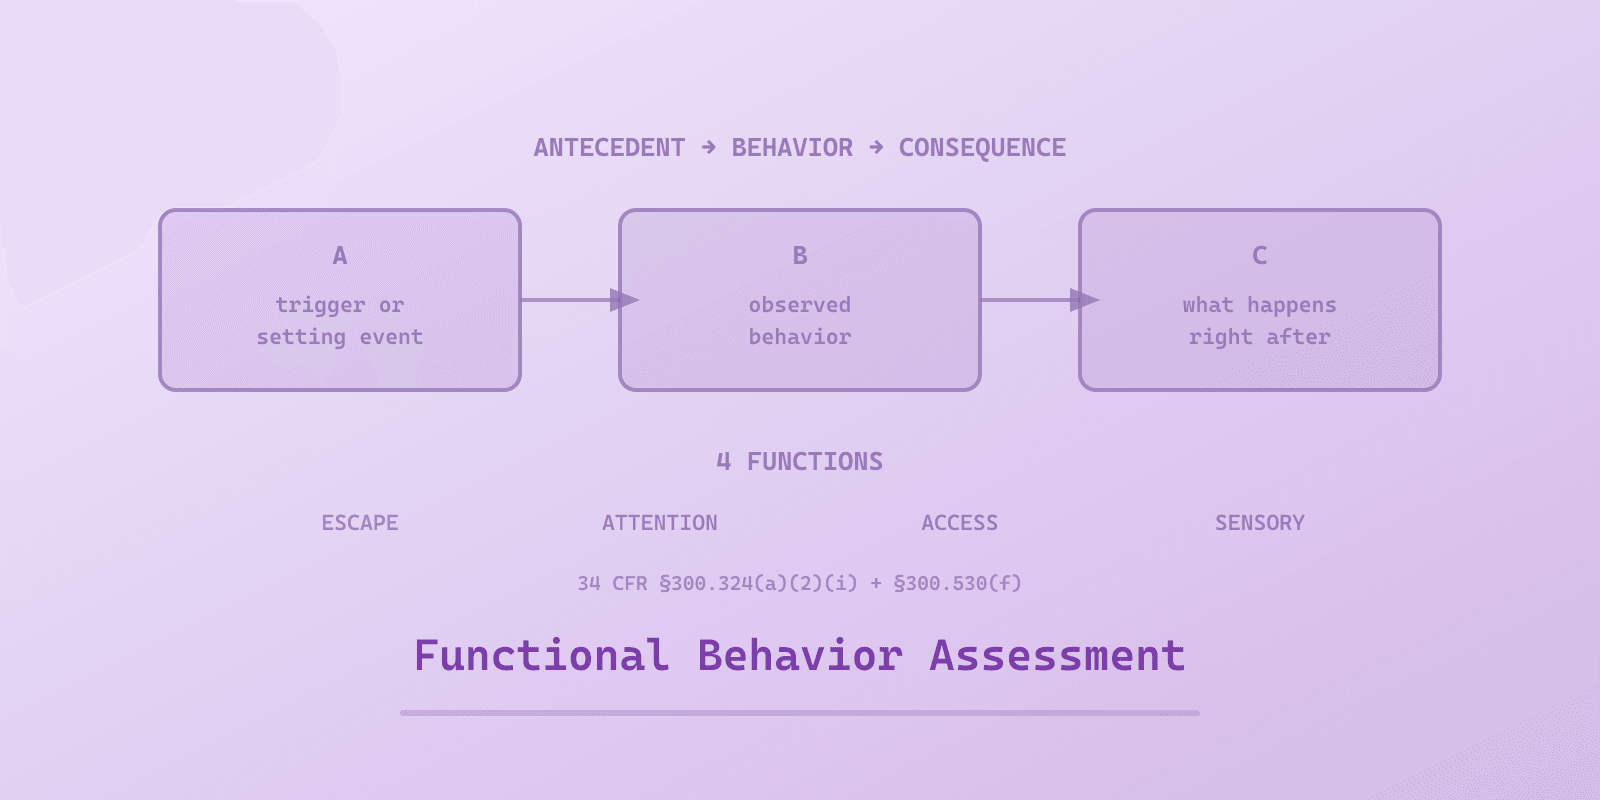
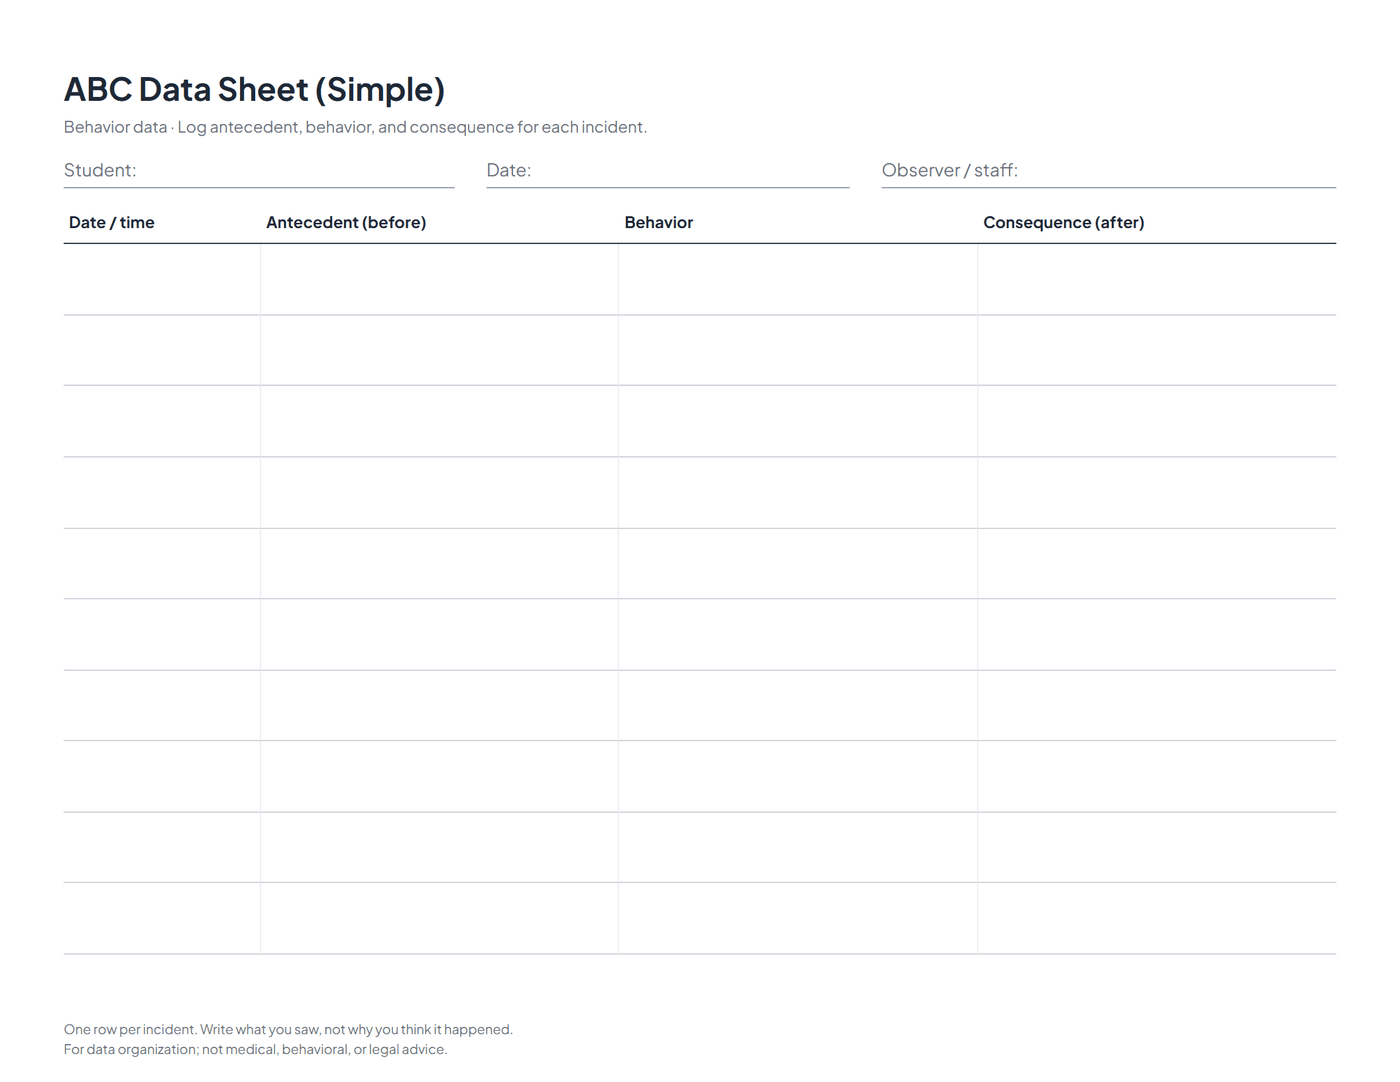
An ABC data sheet is a form for recording three things every time a target behavior happens: the antecedent (what happened right before), the behavior (what the student did, in observable terms), and the consequence (what happened right after). Filled in over a couple of weeks, the columns line up into a pattern that shows why the behavior keeps happening.
That "why" is the whole point. ABC data is not a tally of how often a behavior occurs. It is a description of the context around each incident, and context is what reveals the behavior's function.
Why the function matters more than the count
Every behavior does a job for the student. In behavior analysis, those jobs sort into four functions:
- Escape or avoidance: getting out of a task, a demand, or a setting.
- Attention: getting a reaction from an adult or a peer.
- Access: getting a preferred item, activity, or place.
- Sensory: the behavior itself feels good or relieves discomfort, with no outside payoff needed.
Two students can hit for completely opposite reasons. One hits to escape a hard worksheet; the other hits to get the teacher to come over. The behavior looks identical, but the plan that helps each student is the reverse of the other. ABC data is how you tell them apart, and it is why a plan built without it is usually a guess. That is also why a functional behavior assessment leans on ABC data as its foundation.
The three parts, with examples
Antecedent is what happened in the moments right before the behavior. Be specific: not "transition," but "teacher said it was time to clean up and switch to math." Antecedents are often a demand, a denied request, a change in routine, or a specific person or noise.
Behavior is the observable action, written so a substitute could score it the same way you would. "Threw his pencil and swept papers off the desk" works. "Was disruptive" does not, because two people will count it differently.
Consequence is what happened immediately after, including how everyone responded. "Teacher walked over and moved him to a break area; math was delayed five minutes." The consequence is often the biggest clue to the function, because it shows what the student got or got out of.
How to take ABC data: step by step
- Define the target behavior in observable terms. Write down exactly what the behavior looks like before you record a single incident, so you, an aide, and a substitute all score it the same way.
- Keep the sheet within reach. Print the ABC sheet on a clipboard by the desk, or keep a fillable copy open on a tablet. Data you have to walk across the room to log is data you will skip.
- Record every incident as it happens. Each time the behavior occurs, note the time and setting, then fill the antecedent, behavior, and consequence columns while it is fresh.
- Write what you see, not what you assume. "Pushed the worksheet away and put his head down" is data. "Was frustrated" is a guess. Save the interpretation for later.
- Collect across settings and times. Log the behavior in the settings and times of day where it actually happens, since the same behavior can serve different functions in different rooms.
- Analyze after two to four weeks. Once you have the behavior captured 10 to 15 times, look down the antecedent and consequence columns for what repeats. That repeated pattern points to the function.
A filled-in ABC data sheet example
| Time / setting | Antecedent | Behavior | Consequence |
|---|---|---|---|
| 9:15, math | Teacher handed out the worksheet | Swept papers to the floor, said "no" | Sent to break area, worksheet delayed |
| 10:40, centers | Told to switch from blocks to reading | Dropped to floor, would not move | Given two more minutes with blocks |
| 1:05, math | Worksheet placed on desk | Ripped the page, put head down | Break area, finished worksheet later |
Read down the columns and the pattern is loud: the antecedent is almost always a non-preferred task demand, and the consequence is almost always the task going away. The function is escape. The plan writes itself from there: a visual first-then board, a "break please" card the student can hand over instead of ripping the page, and shorter work chunks with a built-in break.
Reading the pattern to find the function
The trick is to stop reading each row on its own and start reading the columns. Ask two questions of the whole sheet:
- What shows up again and again in the antecedent column? That is what sets the behavior off.
- What shows up again and again in the consequence column? That is what keeps it going.
When the same antecedent leads to the same behavior and the same consequence over and over, you have a hypothesis about the function. If the consequence is usually a task disappearing, the function is escape. If it is usually an adult coming over, the function is attention. If it is usually getting an item or activity, the function is access. If there is no consistent outside payoff and the behavior happens across every setting, the function is likely sensory.
Tips for data you can defend at the meeting
- One operational definition, shared by everyone. If the aide and the teacher are scoring different things, the data is noise. Agreeing what one point means before anyone records a session is the practical fix, and working with paraprofessionals covers how to set that up alongside a shared prompting rule. The same principle decides whether independent work is measurable at all, which is why a good task box says what one point means on the box itself.
- Short, consistent windows beat an all-day log. A reliable ten-minute sample at the same time each day compares week to week. An all-day record you abandon by Wednesday does not.
- Now and then, check that two people agree. Have a second staff member score the same session without comparing notes. When the marks match most of the time, the data is trustworthy enough to bring to the IEP meeting.
- Log it in the moment. Memory reshapes what happened. Fill the row while the incident is fresh, not at the end of the day.
ABC data vs frequency and duration data
ABC data answers why. Once you have the function and a plan in place, you switch to simpler measures to answer is it working:
- Frequency counts how many times the behavior happens in a set period. Use it for behaviors with a clear start and stop, like calling out or hitting; a printable frequency data sheet gives you one row per day to tally against.
- Duration times how long each episode lasts. Use it for behaviors that stretch out, like crying or leaving the area.
Most classrooms run all three across a term: ABC data to find the function, then frequency or duration to track progress against the behavior intervention plan. Parents asked to collect ABC data at home can use the free meltdown tracker for a quick trigger log, or track behaviors in Beacon, which timestamps each antecedent and consequence and surfaces the pattern over a couple of weeks.
Get the printable ABC data sheet
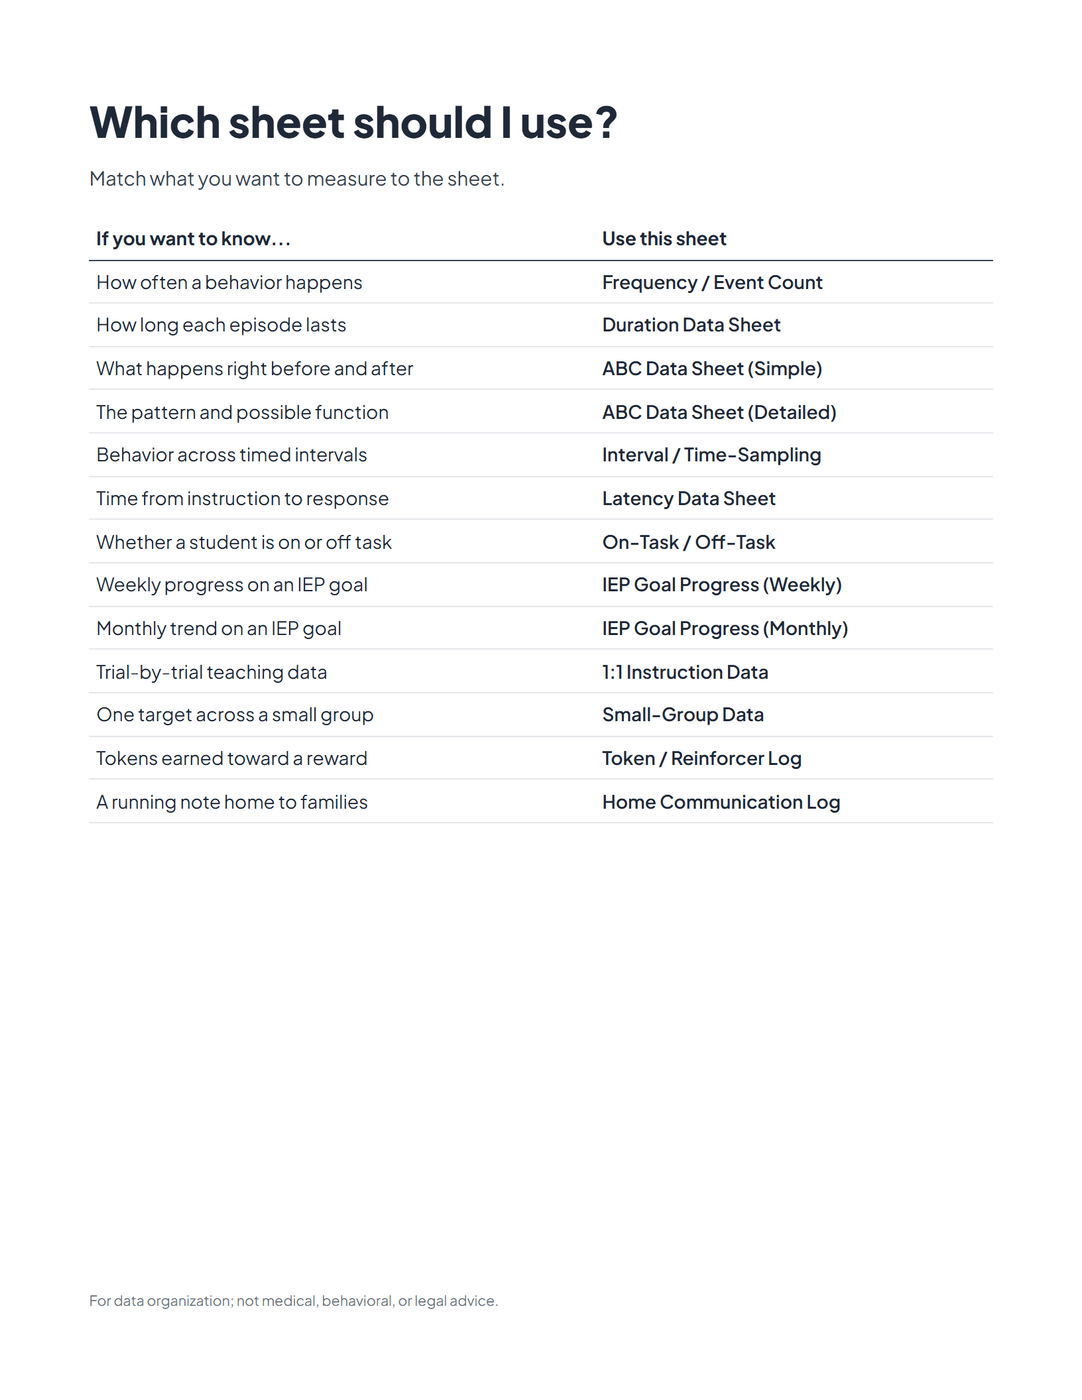
You can grab a free, print-ready ABC data sheet from the Educators resources page, or set your own columns and print one from the free ABC data sheet maker, and start taking data today. When a single incident needs more room than four columns allow, an anecdotal record sheet gives you an open narrative log for the fuller story behind that event. If you want the whole set the classroom runs on, the Special Education Data Sheets pack collects the ABC sheet alongside frequency, duration, interval, IEP goal-progress, and instruction data sheets, in print, type-in fillable, and an auto-calculating spreadsheet that totals the counts and charts IEP progress for you. To see the print quality before paying for anything, the free data sheet sample is one complete sheet from that pack. If you are picking a measurement system rather than a single sheet, the ABA data sheets and therapy resources hub groups all twenty-five templates by what they measure, so frequency, duration, latency and interval sit side by side. If you are a BCBA handing this sheet to a family rather than filling it in yourself, ABA parent training handouts covers which materials caregivers can actually run between sessions. Once the function is identified and you need a count rather than a description, ABA data collection methods compared walks through which measurement fits which question.
Behavior data that answers why, not just how often.
Beacon remembers your students and your setting, so you are not re-explaining them every time.
What would Beacon say?
"Help me read the ABC data I collected"
Beacon reads the pattern in what you already collected, suggests what the behavior is doing for the student, and names the replacement skill to teach.

Spectrum Unlocked Editorial Team
Editorial Team
The Spectrum Unlocked editorial team combines lived experience as autism parents with research-backed guidance to create resources families can trust.
Frequently asked questions
- What is an ABC data sheet?
- An ABC data sheet is a form used to record the antecedent, behavior, and consequence each time a specific behavior occurs. The antecedent is what happened immediately before the behavior, the behavior is the observable action itself, and the consequence is what happened immediately after. Collected over time, the sheet reveals the pattern behind the behavior so the team can identify why it keeps happening.
- What does ABC stand for in ABC data?
- ABC stands for Antecedent, Behavior, and Consequence. The antecedent is the trigger or event right before the behavior, the behavior is what the student actually did described in observable terms, and the consequence is what happened right after, including how adults and peers responded. Together the three columns show the sequence that keeps the behavior going.
- How do you take ABC data?
- Define the target behavior in observable words, keep a printed or digital ABC sheet on hand, and each time the behavior occurs write down the antecedent, the behavior, and the consequence along with the time and setting. Record what you actually see rather than your interpretation. After two to four weeks, look for the antecedent and consequence that repeat most often, since that pattern points to the behavior's function.
- What is the difference between ABC data and frequency data?
- ABC data is descriptive. It captures the context around each incident to help you find the function of a behavior. Frequency data is a simple count of how many times a behavior happens in a set period. You usually start with ABC data to understand why a behavior is happening, then switch to frequency or duration data to measure whether an intervention is working.
- How long should you collect ABC data?
- Most teams collect ABC data across two to four weeks, or long enough to capture the behavior at least 10 to 15 times across the settings and times of day where it happens. A single day rarely shows a reliable pattern. Consistent short samples at the same times each day compare better week to week than an all-day record that is hard to keep up.
- Who uses ABC data sheets?
- Special education teachers, paraprofessionals, board-certified behavior analysts (BCBAs), school psychologists, and speech and occupational therapists all use ABC data sheets. Parents are often asked to collect ABC data at home too, since a behavior that only happens in one setting is an important clue to its function.